Shiba Inu Price Prediction: Breakout and Next Targets
Note: This post may contain affiliate links, and we may earn a commission (with No additional cost for you) if you make a purchase via our link. See our disclosure for more info. The crypto world is constantly changing. This content is for informational purposes only and not financial, legal, or professional advice So, please verify the info on the cryptocurrency provider’s websites.

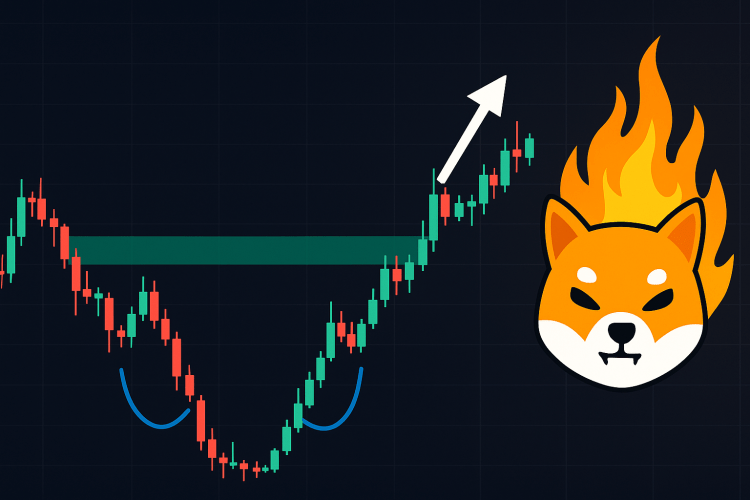
Shiba Inu (SHIB) has successfully completed an inverted head-and-shoulders pattern, a bullish technical indicator. This pattern, confirmed by analyst Cantonese Cat, suggests a potential price surge. The breakout has already pushed SHIB to its highest point since early February, reaching $0.00001765 before a minor pullback. The retest of the neckline support zone between $0.00001400 and $0.00001470 validates the pattern's completion. Fibonacci retracement levels, calculated from last summer's high ($0.00004569) and March's low ($0.00001030), project potential upside targets. The 23.6% retracement sits at $0.00001865, followed by the 200-day EMA at $0.00001603. Further targets include the 38.2% retracement at $0.00002382, the midpoint at $0.00002799, and potentially even higher levels at $0.00003217 and $0.00003811. However, failure to hold above the neckline support at $0.00001430 would invalidate the bullish scenario. This could lead to a drop towards the 50-day EMA ($0.00001399) and ultimately to the cycle floor at $0.00001030. The overall short-term outlook remains bullish, with potential for further price increases, contingent upon maintaining support above the neckline. The analysis uses technical indicators and chart patterns to forecast SHIB's future price movements, highlighting both upside potential and downside risks.
(Source: https://www.newsbtc.com/shiba-inu/shiba-inu-bulls-roar-to-life-after-breakout/)