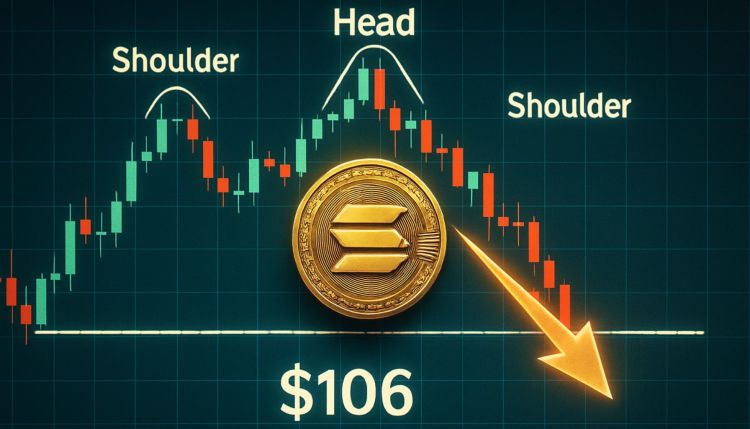
Solana Price Crash: Head and Shoulders Pattern Signals $106?
Note: This post may contain affiliate links, and we may earn a commission (with No additional cost for you) if you make a purchase via our link. See our disclosure for more info. The crypto world is constantly changing. This content is for informational purposes only and not financial, legal, or professional advice So, please verify the info on the cryptocurrency provider’s websites.


Solana (SOL) has experienced a significant price drop, breaking below crucial support levels and confirming a bearish Head and Shoulders pattern. This pattern, identified by analyst Carl Runefelt, suggests a potential decline to around $106. The breakdown follows news of a US attack on Iranian nuclear facilities, exacerbating existing macroeconomic and geopolitical uncertainties. The drop is not isolated to Solana; the broader altcoin market is experiencing weakness as investors move towards safer assets like Bitcoin and stablecoins. Solana's failure to reclaim previous support levels, coupled with negative momentum indicators, points to a bearish outlook. The price has fallen below the 200-day simple moving average (SMA) around $149.54, a key indicator of bearish sentiment. High volume on the red candles confirms increased selling pressure. While Solana performed strongly in previous cycles, its current price action shows a decisive bearish shift, trading over 50% below its all-time high. A move back above $149 could reverse the short-term bearish trend, but until then, the risk of further losses remains significant. The $120-$125 range, previously a support level, could be revisited if the current trend persists. The overall situation highlights the impact of global uncertainty on cryptocurrency markets, particularly altcoins like Solana.