Technical Analysis
Note: This post may contain affiliate links, and we may earn a commission (with No additional cost for you) if you make a purchase via our link. See our disclosure for more info. The crypto world is constantly changing. This content is for informational purposes only and not financial, legal, or professional advice So, please verify the info on the cryptocurrency provider’s websites.

Technical analysis is a way traders try to guess where stock prices are headed, using past price and volume data like it's some kind of crystal ball. It's all about trends—ignoring boring stuff like the actual company value. Picture it: charts everywhere, patterns like triangles and head-and-shoulders popping up, and fancy indicators like RSI attempting to predict the future. Sure, critics say it's flawed, but hey, every method has its baggage. Stick around to uncover the nitty-gritty.

Technical analysis. It's a fancy term for the art of predicting stock prices using past price and volume data. Sounds simple, right? It operates on the assumption that current prices reflect every piece of information out there. So, if you think about it, the market knows what it's doing—at least, that's the theory. Humans are creatures of habit, and that's where recurring patterns come into play. Technical analysis thrives on these patterns, thanks to investor psychology and the idea that trends tend to stick around for a while. Forget about intrinsic value; this is all about short-term trades and price action.
Technical analysis: predicting stock prices using past data, where patterns and investor psychology rule the short-term trading game.
The roots of technical analysis trace back to the late 19th century, with Charles Dow laying down the groundwork. He introduced the Dow Theory and stock indices, which paved the way for the mathematical indicators we see today, like the RSI and momentum. Books by experts like Edwards, Magee, and Murphy made it all sound legit. Joseph de la Vega's accounts in the 17th century contributed to early technical analysis, showcasing the long history of this discipline.
Fast forward to the 1980s, and computers took over. Digital charting? Count me in! Now, technical analysis is everywhere—equities, forex, futures, cryptocurrencies—you name it.

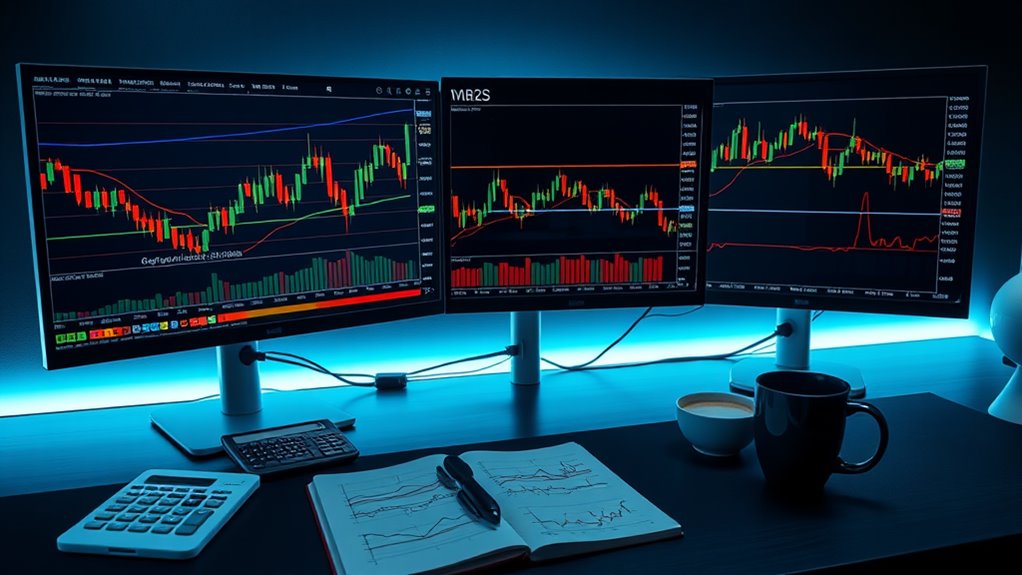
Chart analysis is the bread and butter. It identifies patterns like head and shoulders or triangles—no, not the haircut. Indicators like moving averages and RSI help traders gauge momentum, while support and resistance levels act like invisible lines in the sand. Volume analysis? Vital. It tells you if a trend is solid or just smoke and mirrors. Technical analysis serves as a predictive tool to complement traditional fundamental analysis, allowing traders to make better-informed decisions. When trading cryptocurrencies, incorporating stop-loss orders can significantly enhance your technical strategy by protecting against sudden market reversals.
But, let's not ignore the elephant in the room. Critics roll their eyes at the Efficient Market Hypothesis, claiming prices reflect all information, making patterns a tad unreliable. Plus, not everyone sees the same patterns—subjectivity is real.
And don't even get started on macroeconomic shocks; those can throw a wrench in any chart. Technical analysis isn't perfect. But hey, neither is anything else in finance.
Frequently Asked Questions
What Are the Main Tools Used in Technical Analysis?
When diving into the world of market analysis, several tools pop up repeatedly. Think trendlines, support and resistance levels—your basic chart patterns. Moving averages? Oh yeah, they're essential.
Then there's MACD and RSI, the go-to momentum indicators. Fibonacci retracement levels? Don't forget those. Toss in some Bollinger Bands and a sprinkle of oscillators, and you've got a toolbox ready for action.
It's like a DIY kit for traders—minus the manual, of course.
How Does Technical Analysis Differ From Fundamental Analysis?
Technical analysis and fundamental analysis are like oil and water.
One's all about numbers and financial statements, while the other focuses on price trends and charts.
Fundamental analysis is for those who like long-term planning—years, even.
Technical analysis? It's for thrill-seekers, chasing quick trades.
One looks at the company's worth; the other? Just its price history.
It's like comparing a slow-cooked meal to fast food—both satisfying, just different appetites.
Can Technical Analysis Predict Market Crashes?
Market crashes? Yeah, they're tricky.
Some folks think certain indicators can predict them. Like, "Hey, look at that moving average!" But reality check: they're not foolproof.
Sometimes, they scream "crash!" when it's just a hiccup. Sure, a few models get it right, but false alarms happen too.
It's a mix of signals, sentiment, and good old human panic.
What Timeframes Are Best for Technical Analysis?
When it comes to timeframes, it's a mixed bag. Long-term charts? Great for spotting trends, but who has the patience?
Intermediate ones help refine decisions, while short-term charts are like caffeine: jittery and risky. Day traders love 'em, but good luck with that noise!
The point? Different strokes for different folks. Start big, then zoom in. Just don't get lost in the chaos. It's a wild ride, so buckle up!
How Do Emotions Affect Technical Analysis Outcomes?
Emotions can totally wreck decision-making.
Fear? It makes traders bail on good positions during downturns.
Greed? That leads to ignoring warning signs, chasing trends, and ultimately, disaster.
Throw in biases, and you've got a recipe for chaos.
Traders cling to losing bets out of stubbornness.
FOMO? It pushes impulsive trades without thinking.
Emotional discipline? Yeah, it's hard to maintain when panic and excitement are at play.
In short, feelings can sabotage even the best strategies.